
New: Full Dyno Data for Every PhasedApproach Customer
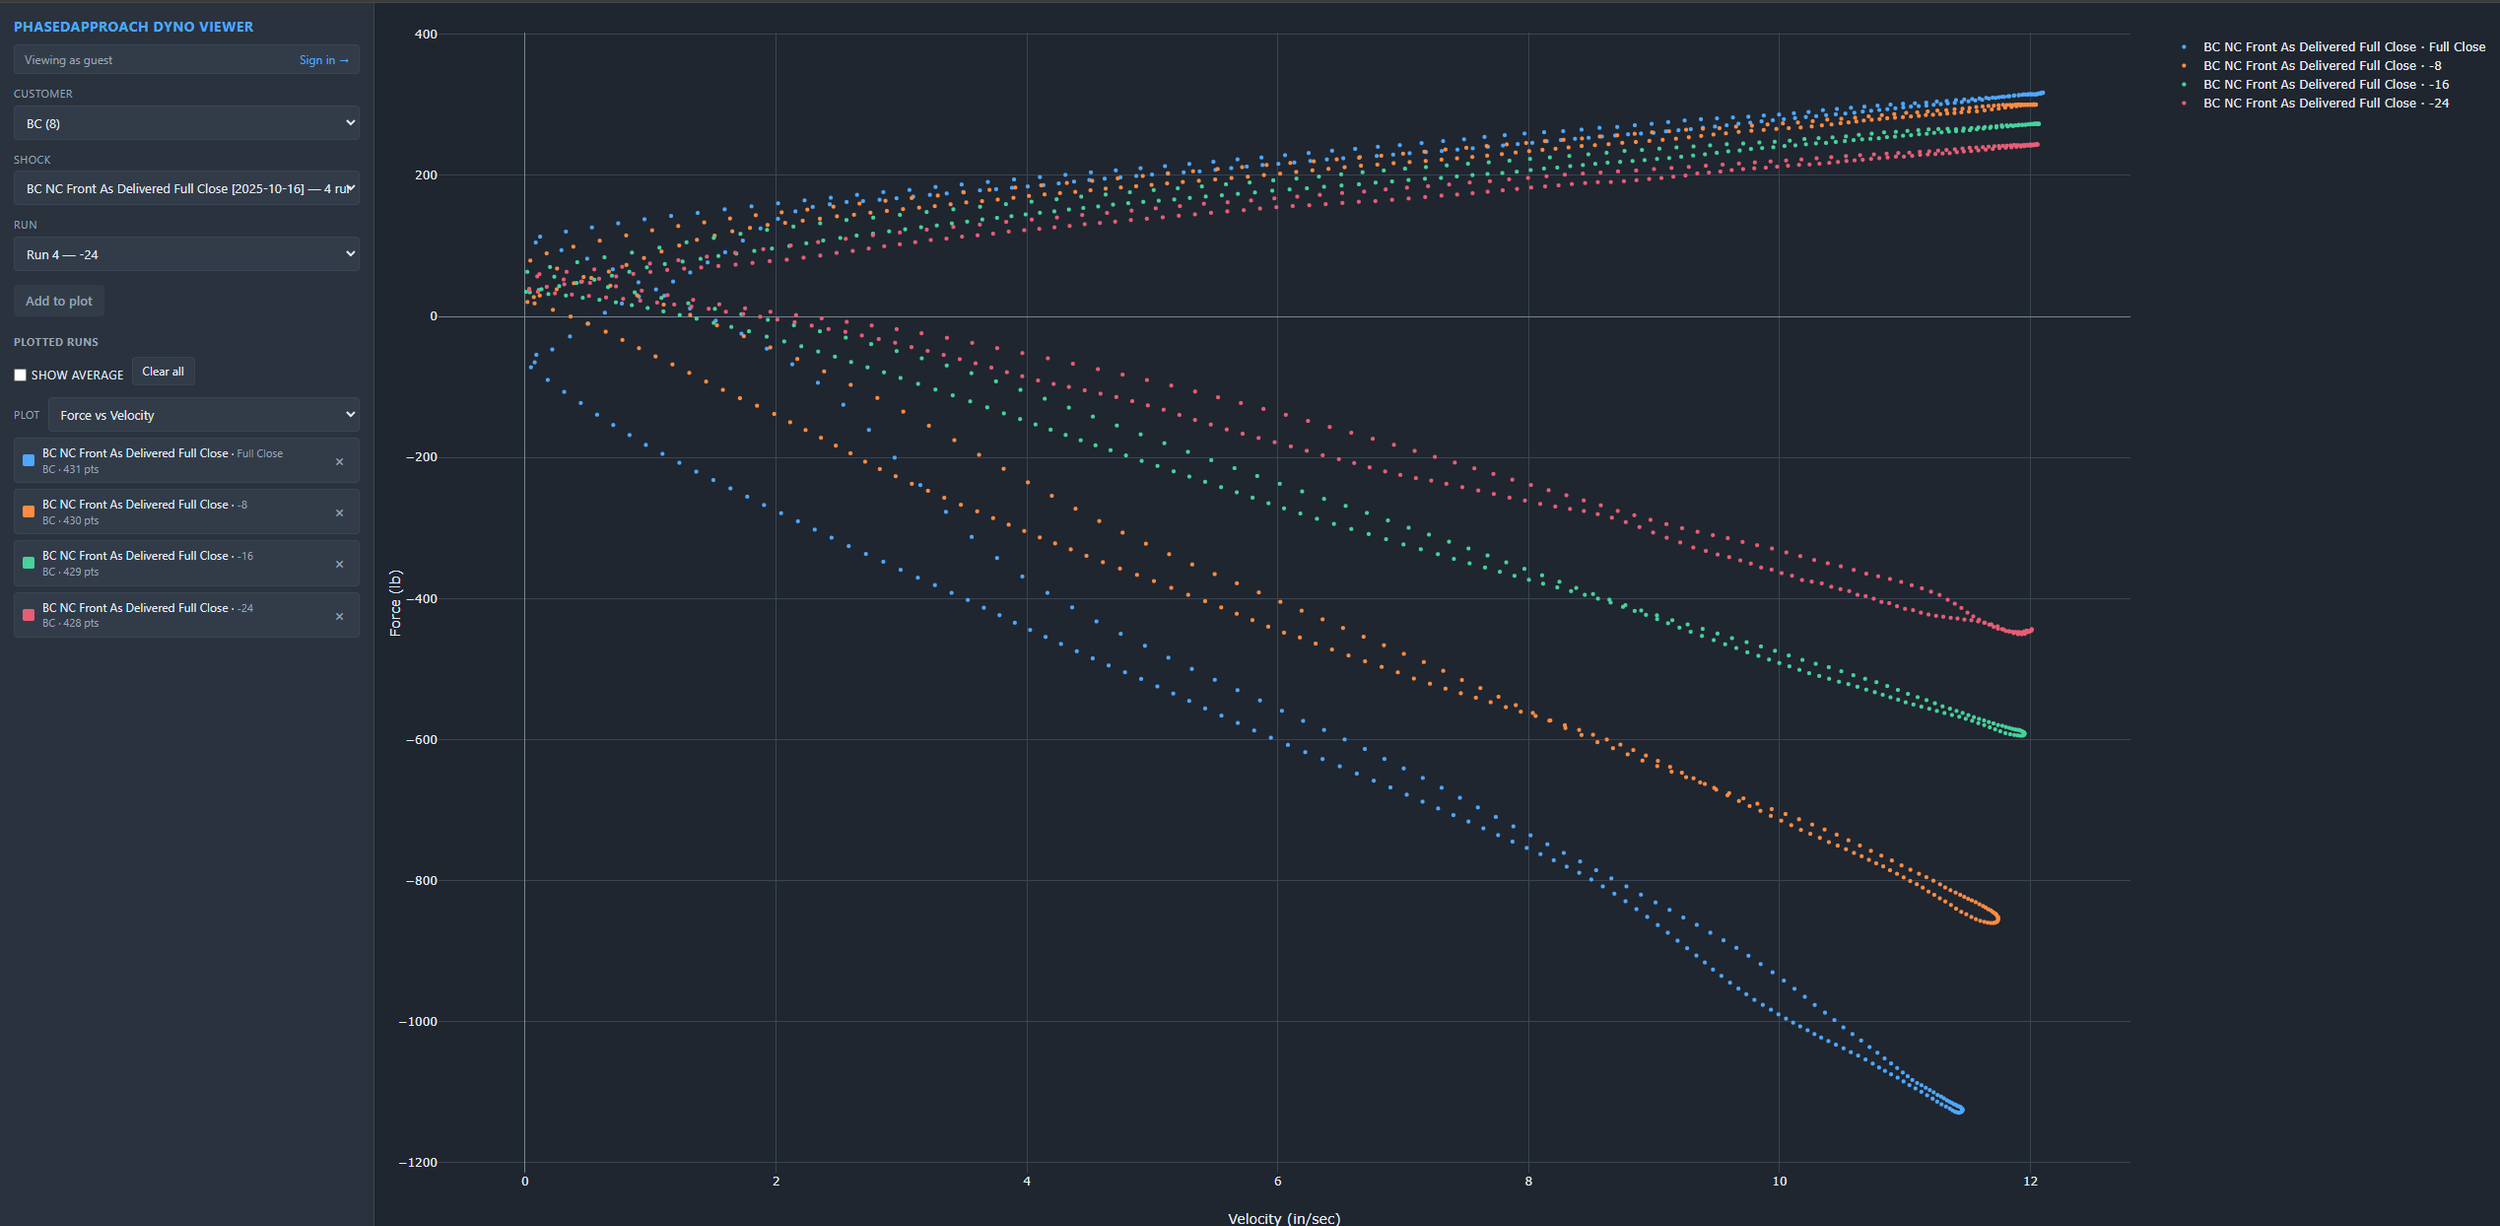
BC NC Miata Front Damper Sweep using PhasedApproach Dyno Viewer
See Every Point: The PhasedApproach Dyno Viewer
Every shock we build or test for a customer gets dynoed, and now that data lives online. The PhasedApproach Dyno Viewer gives our customers full-time, browser-based access to their own runs — no software to install, no waiting on a PDF, no digging through old printouts. You log in, pick your shock, and the complete dyno data is right there whenever you want it.
Want to see how it works before you have your own data in it? We've loaded sample runs from a set of off-the-shelf BC Racing shocks so anyone can open the viewer and get a feel for it.
Why this is different
Plenty of shock builders and sellers don't dyno at all — you buy the part and trust it's right. Many who do dyno only hand you a PVP: a peak velocity plot that boils each velocity down to a single force number. It's better than nothing, but it hides almost everything interesting about how the damper actually behaves.
We do the opposite. For everything we build or test, we give you the complete, point-by-point runs straight off the dyno, available to view any time. The viewer makes it quick to pull up two graphs: reach for Force vs. Velocity when you want to understand how the shock is tuned — how much compression and rebound force it makes across shaft speeds. Switch to Force vs. Displacement when you want to see where in the stroke things are happening and spot anything off, like cavitation or unexpected force changes.
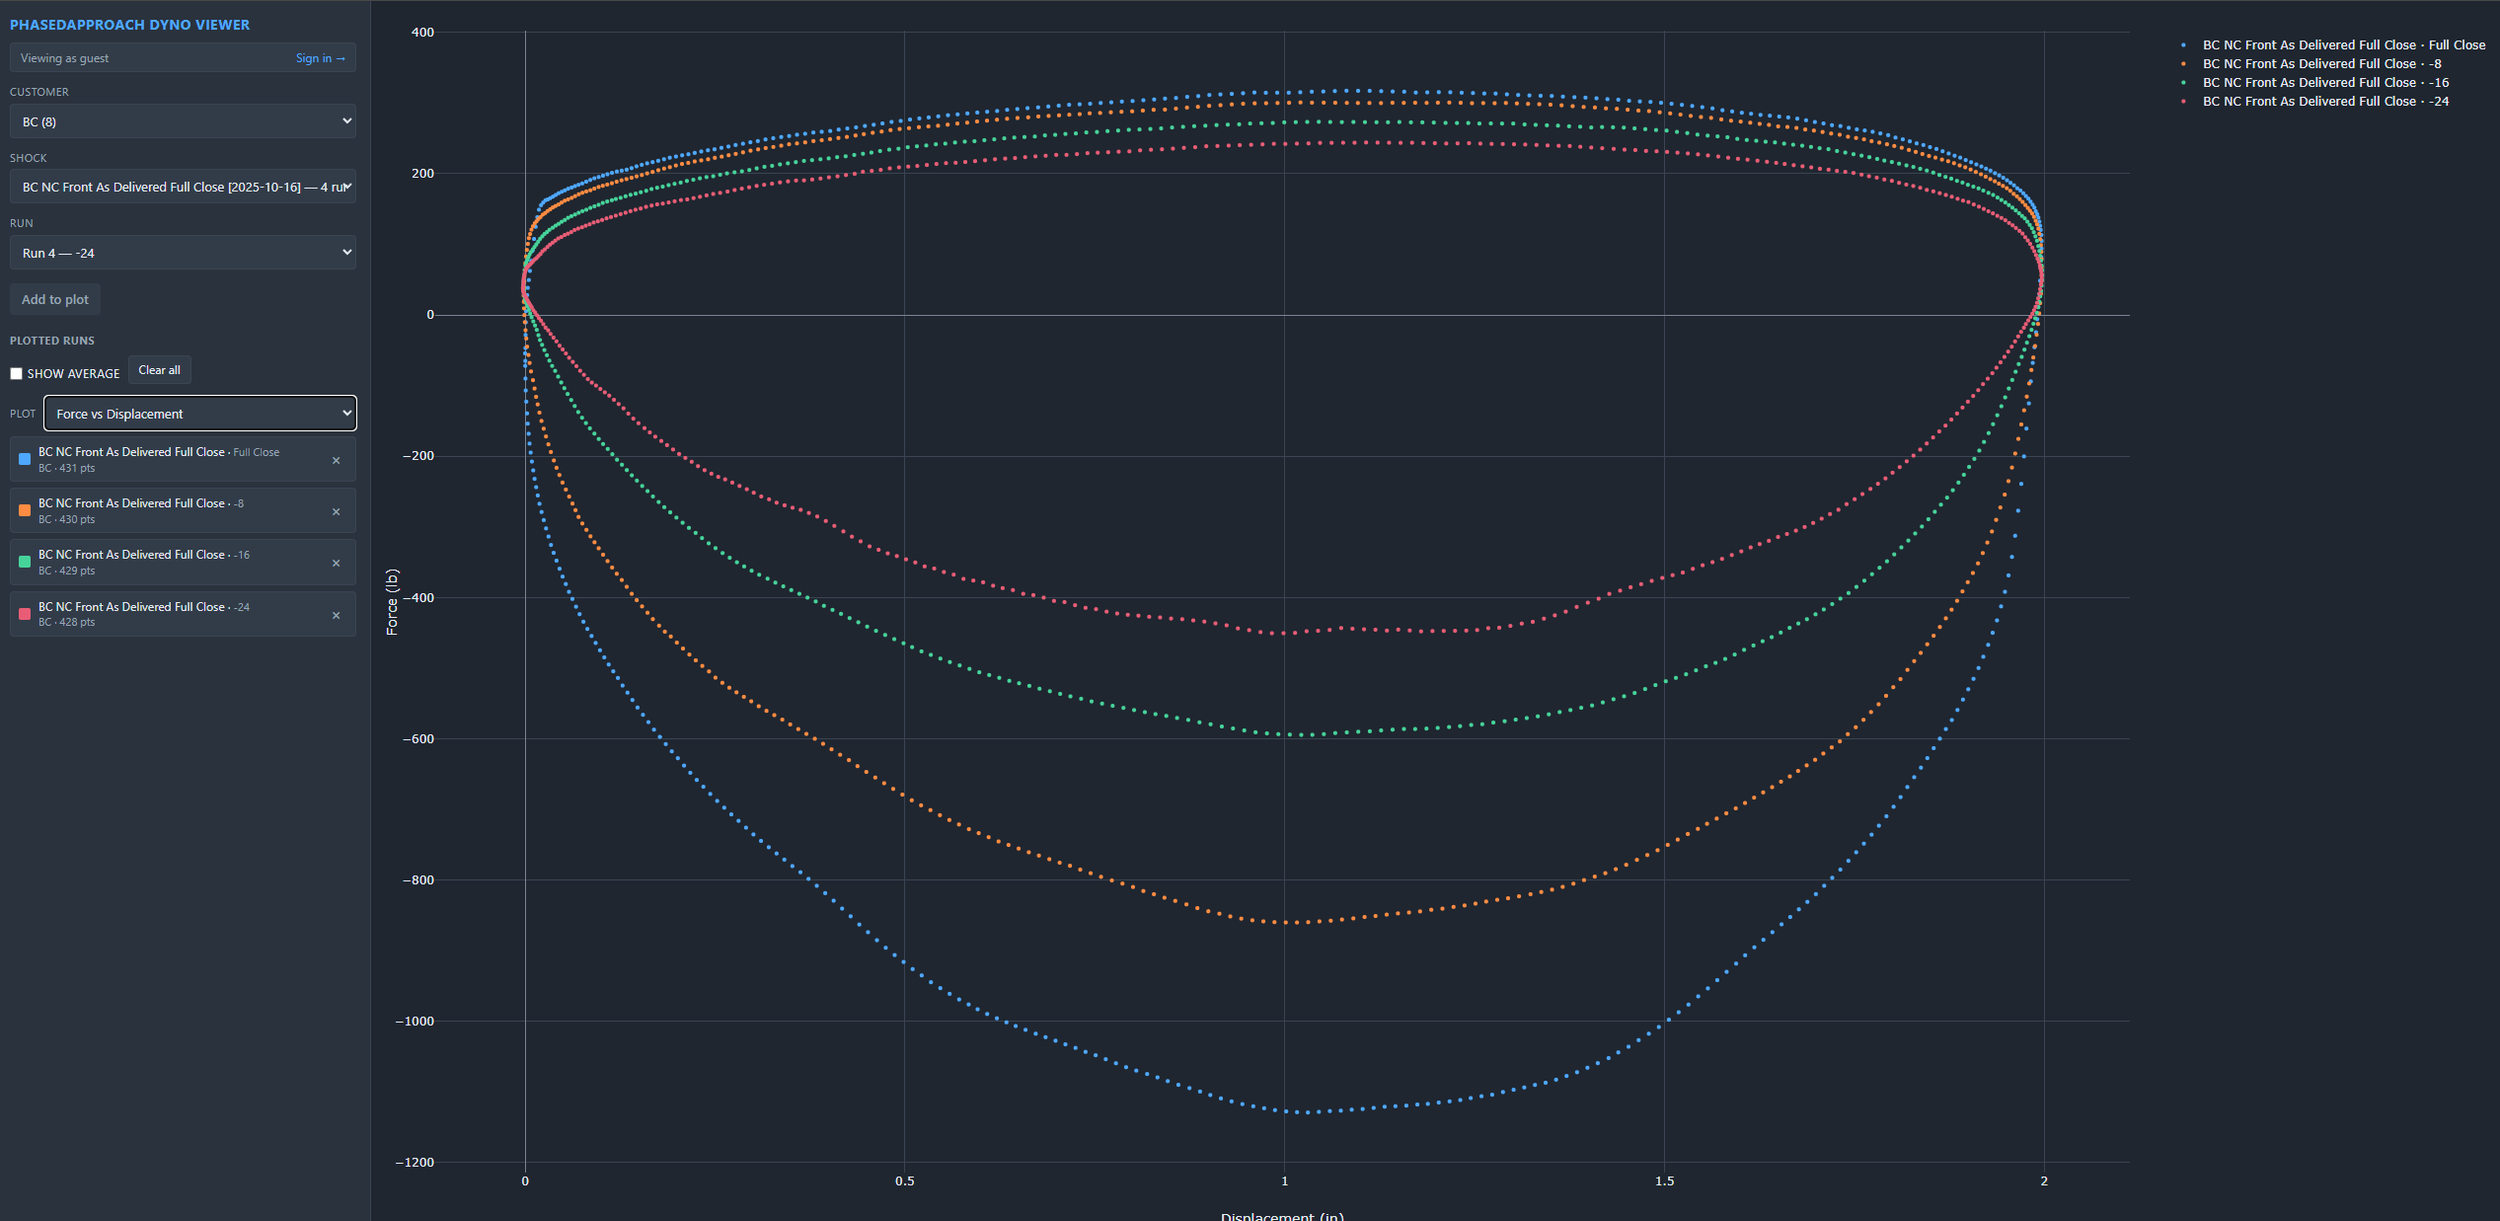
Hysteresis, not just a number
That detail matters most on the Force vs. Velocity graph. A peak plot draws one force per velocity. Our F/V curves show the full trace — and because a shock generates slightly different force while it's accelerating toward a speed than while it's decelerating away from it, the complete data forms a loop. The gap between those two lines is hysteresis, and it's where you read seal drag, gas pressure problems, and cavitation. A single-force plot erases all of it. We leave it in, because that's the part that tells you whether the shock is healthy.
Built for looking at your shock
The viewer can overlay multiple shocks if you want to compare, but most of the time you're here to do one thing: look closely at a single shock and understand exactly what it's doing. That's what it's built for. Pick your runs, read the Force vs. Velocity and Force vs. Displacement plots, and see the real, complete picture of your damper — the same data we used when we built or tested it.
Take a look at the BC Racing sample data at apps.phasedapproach.com/dyno-viewer, and if you're already a customer, your own runs are waiting.